Río de Janeiro, Brazil
| Company: | Tauri Engenharia Ltda. - part of New York Geomatics Inc. |
| Website: | tauri-eng.com/ |
| Location: | Río de Janeiro, Brazil |
| Name: | Enrique Vega León |
| Position: | Civil Engineer |
| E-mail: | [email protected] |
Use Case
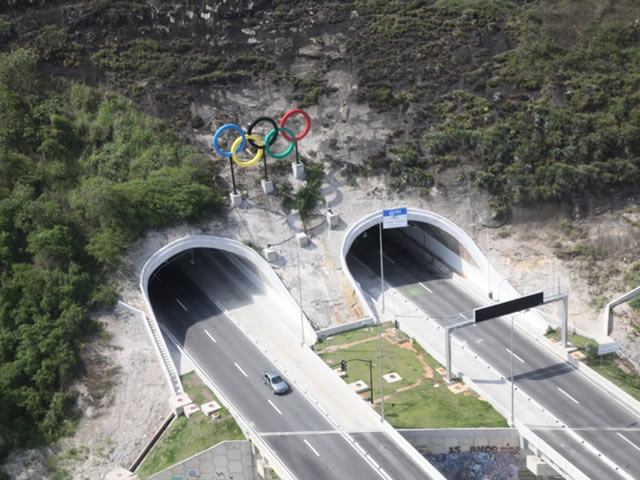
The Transolympic Highway is located in the heart of west Rio de Janeiro and provides a direct service to the residents in that region.
West Rio de Janeiro is the second most populated region in the city with more than 2,500,000 people today. This area registers the highest economic growth and has the highest concentration of new real estate developments in the city of Rio de Janeiro.
The Transolympic road runs through the neighbourhoods of Recreio, Riocentro, Camorim, Curicica, Taquara, Jardim Sulacap, Vila Militar, Magalhães Bastos and Deodoro. Users of the Transolympic Highway living in its areas of influence have the option of 12 large shopping centers and seven university campuses, among other facilities geared to consumption, leisure and education.
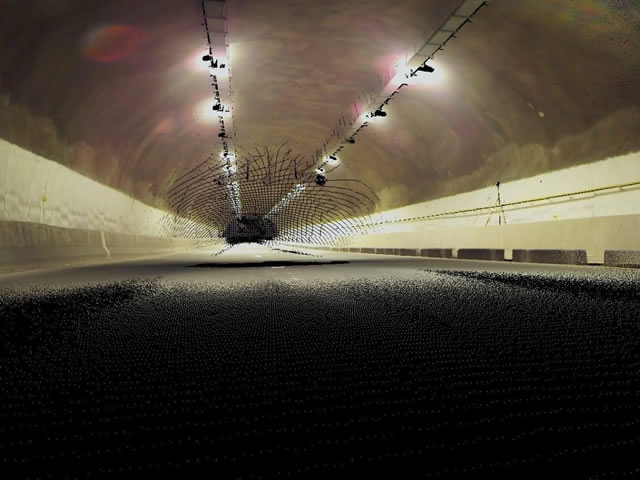
Around 50,000 vehicles travel along the Expressway in both directions on a daily basis. It is the first highway in the city with an exclusive BRT (bus rapid transit) corridor, which serves around 70,000 passengers a day.
The road features 4 tunnels with a total length of 3,200 meters, 22 metres in width and 10 metres in height. The company Tauri Engenharia was entrusted with the geotechnical monitoring of the project by means of scanning.
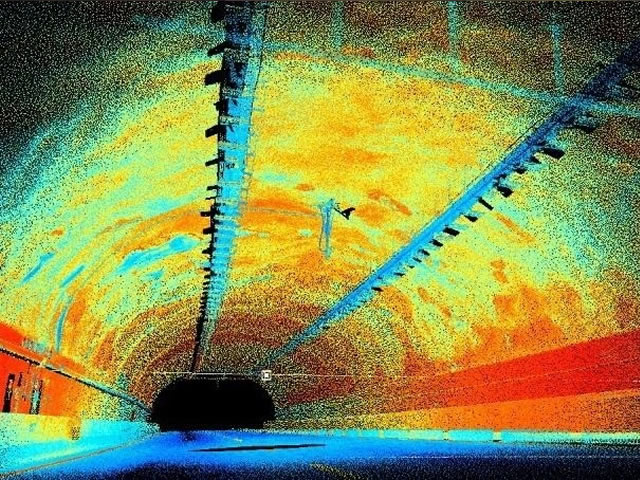
The central axis of the project was defined using TcpScancyr, located between the north and south lanes, in addition to the different standard sections, which were imported from CAD drawings and specifying the corresponding control points.
A Topcon brand GLS2000 model scanner was used for the monitoring process, which consisted of different scanning sessions with approximately 131 million points in total. In addition to the coordinates, each point features RGB colour and intensity.
The next step was the calculation of profiles based on the point cloud, with one profile for every meter, and plans were automatically generated comparing the current profile, the base profile and the standard section and labelling the distances at the control points.
Moreover, detailed reports on areas and volumes were generated for the certifications and inspection maps and animations were created to allow for the strict control of the tunnel works.
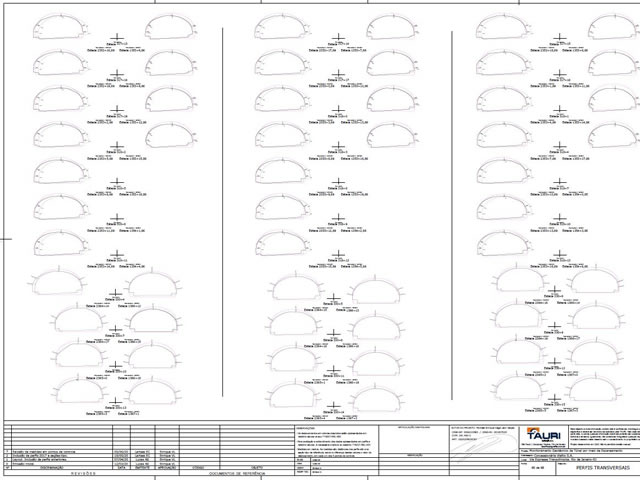
TcpScancyr has enabled us to successfully provide our clients with Geotechnical Tunnel Monitoring solutions, with the intensive use of geometric data, in an extremely fast and reliable manner, placing the company at the forefront in Brazil as the number one provider of geomatic solutions for complex projects.

